COVID-19 claimed the lives of two Cibola County residents in December. The virus remains deadly, masks and social distancing remaining the most effective tools to prevent virus spread according to the US Centers for Disease Control. November and December both saw the death of two Cibola residents, following September and October where no resident died of COVID.
The active case count of COVID in the county has dropped significantly over just one week in a sign that the virus’ spread is slowing. More data will be necessary before a definitive trend can be identified. January begins with 373 active cases, a large break from just a week prior where Cibola had 393 active cases at the end of December. This is a decrease of 20 active cases over one week.
COVID has been a persistent problem since it first appeared in Cibola in March of 2020, it was especially prevalent in December 2022. At the beginning of the month, the CDC declared Cibola’s COVID-19 spread as being in the “Medium” category, exactly one week later the CDC upgraded this rating to “High”. One week after this, the CDC lowered Cibola back to the “Medium” category, in the final week of data reporting for December, the CDC lowered Cibola back to the “Low” category, for the first time all month. Data for January 2 shows Cibola is still in the “Low” category.
Understanding Data Inaccuracies
Vaccine data for Cibola County was questionable after three full months of the same data, with no changes made to the data even after Cibola Citizen staff received their booster shots. Because the data did not change, the newspaper decided to investigate the data. The New Mexico Department of Health tracks vaccine data for every county in the state, this data is collected when pharmacists report their usage of a vaccine. Some data reporting lags because not every pharmacy reports on the same day they used the dose. While the NMDOH may report cases internally, they have not been updating the public data. Trevor Dermody, NMDOH Communications Specialist, did not answer any questions but did send an Excel Spreadsheet of statewide COVID data that had a timestamp of December 27, with an updated sheet of vaccinations per county; that same day, the public data was updated.
The month of October began with 19,867 residents who had only one COVID19 shot; 16,564 had received at least two shots. These numbers did not change through the five weeks or data reporting for October, the four for November, or the four for December. The numbers finally changed in the first week of reporting in January. Currently, data shows that 19,904 county residents have received at least one shot; 16,617 have received at least two COVID-19 vaccine shots.
COVID Increases in December
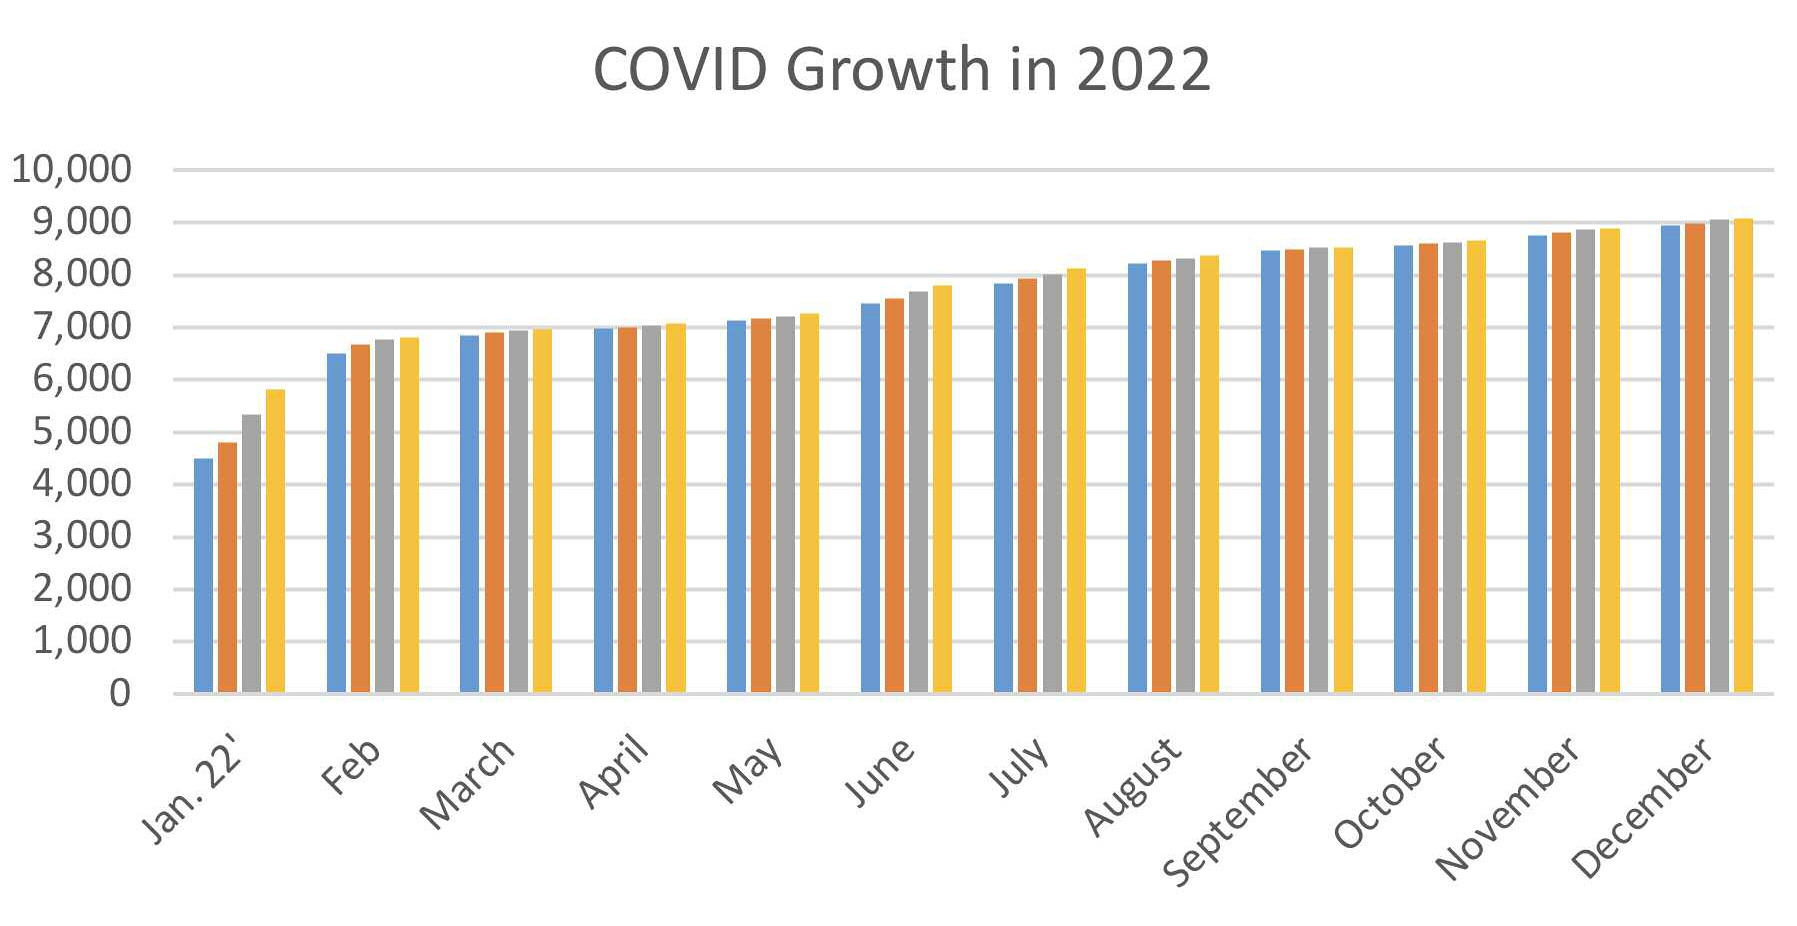
COVID-19 has been on the rise all year long, but saw a larger increase in cases in December than in November. December 2022 had 124 new COVID-19 cases officially recorded. November had 119 new infections, in comparison. The true number of infections is likely significantly higher according to the CDC As December began, Cibola had 8,952 cases. When the month ended, Cibola had 9,077 cases. This is more cases in December compared to 119 in November, 160 in October, and 70 in September. September remains the only month of 2022 where Cibola added less than 100 new cases.
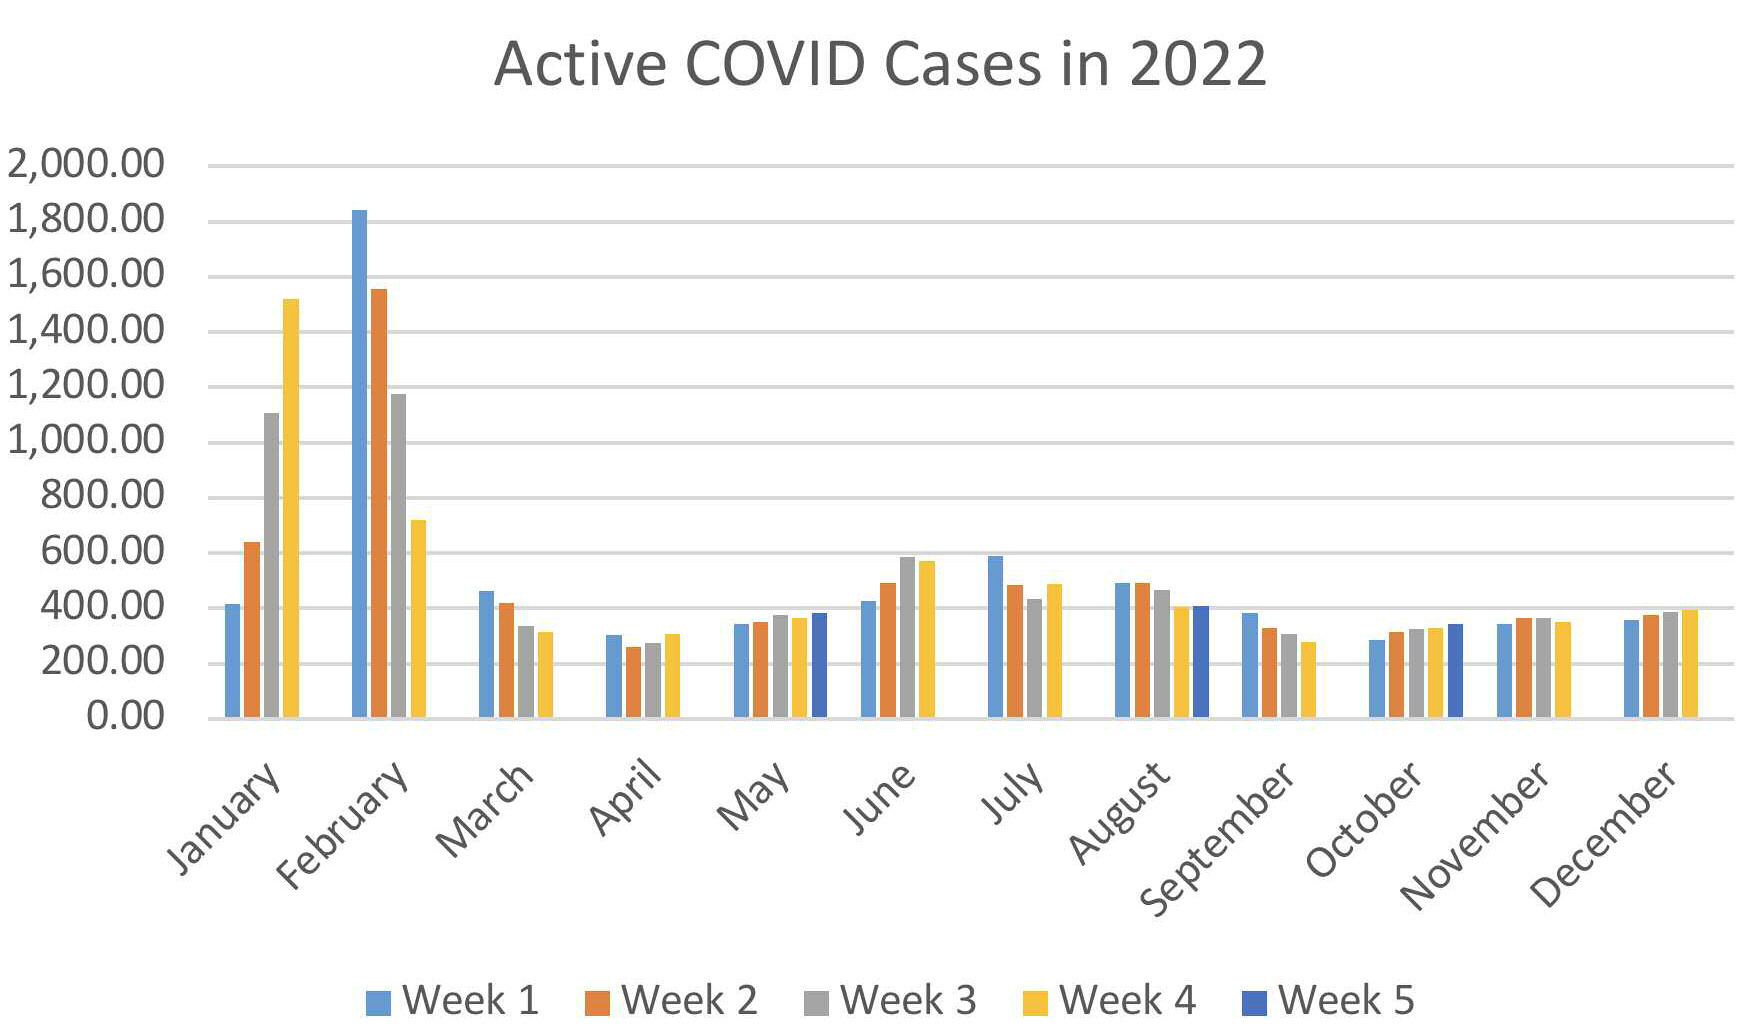
When December began, there were 360 active cases in Cibola. This number increased to 375 in the second week, then 387 in the third week. Cibola capped off December with 393 active cases, all month long the active caseload climbed and climbed, but has fallen so far in 2023 with only 373 active cases currently recorded in Cibola.
New Cases in Cibola
January had 1,311 new cases. February had 308 new cases. March had 115 new cases. April had 106 new cases. May had 222 new cases. June had 330 new cases. July had 290 new cases. August had 217 new cases. September had 70 new cases. October had 160 new cases. November had 119 new cases. Decemberadded124newcases.
COVID-19 Increases by Age Group
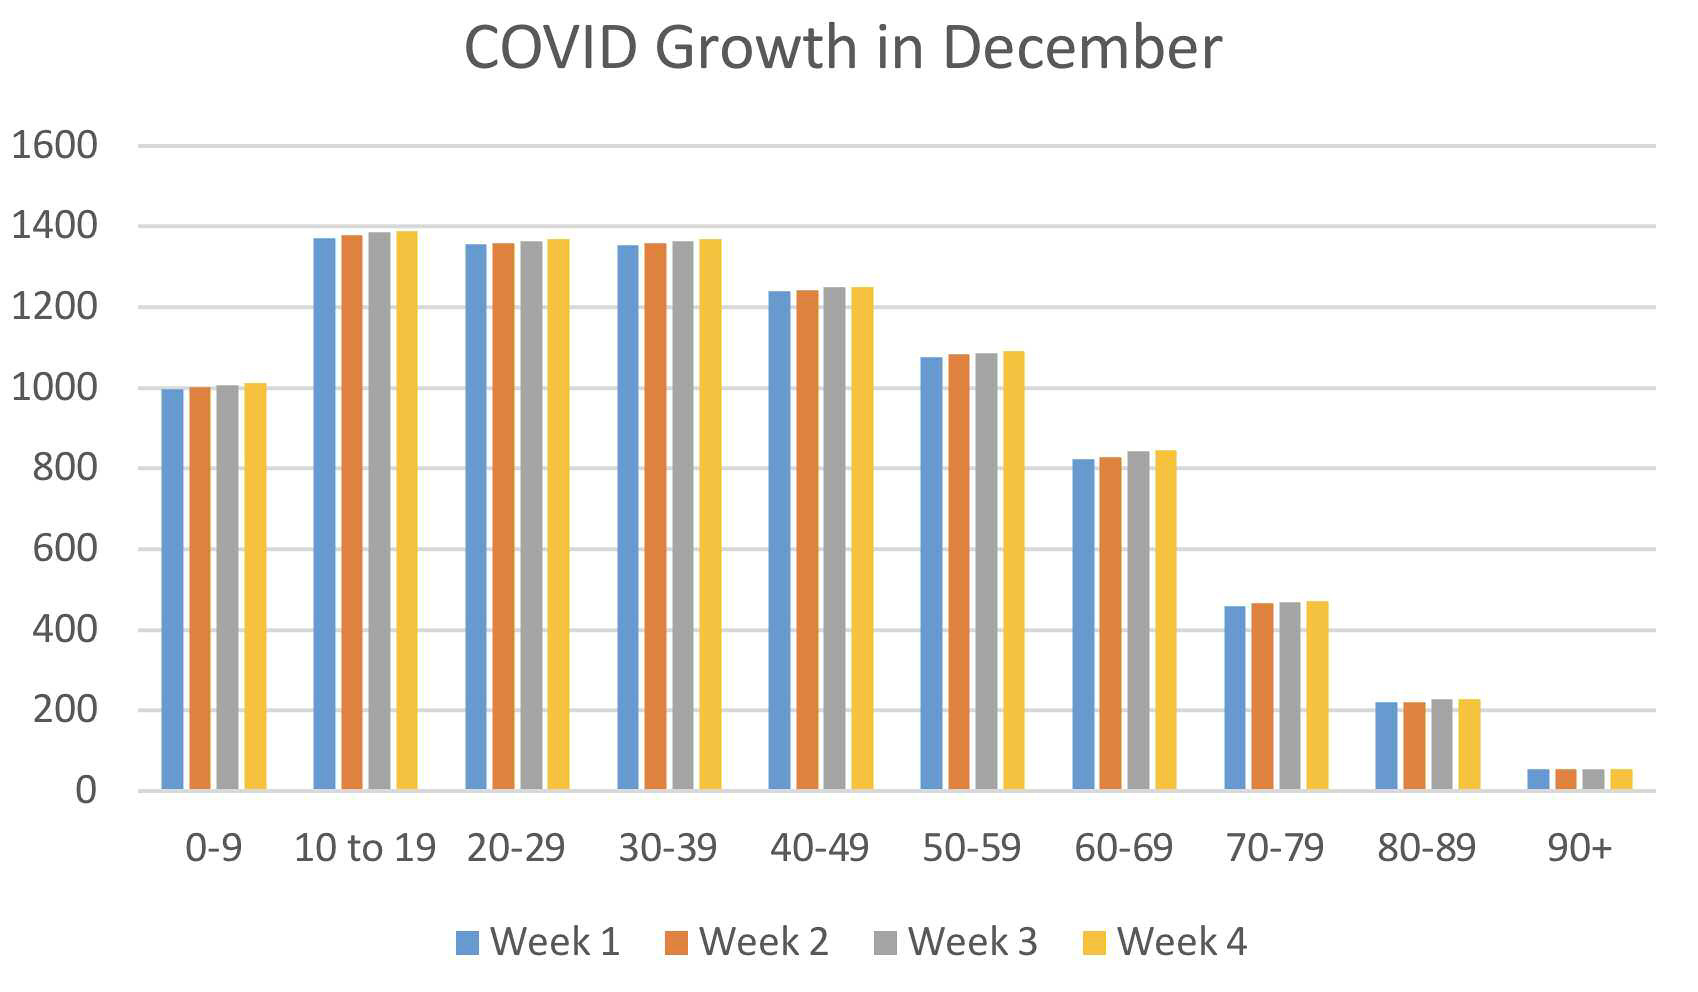
In a break from every month of COVID-19 reporting so far, the 60-69-yearold age group led Cibola County’s COVID-19 case growth. The 10-19-year-old age group had the second highest increase, and the 3039-year-old age group had the third highest increase.
The 60-69-year-old age group increased Cibola’s COVID infection count by 22 cases this month.
The 10-19-year-old age group increased the county’s infection count by 17 in December.
The 30-39-year-old age group increased the county’s infection count by 16 cases in through the month.
For the second month in a row, the 90+ year old demographic did not add a single case to the county’s case count. The 80-89-year-old age group added only six cases through the month, and the 70-79-year-old age group tied with the 40-49-year-old age group for the third lowest increase of case counts, with 11 new cases.