Anomalies in data effect the graphing
CIBOLA COUNTY, N.M. –
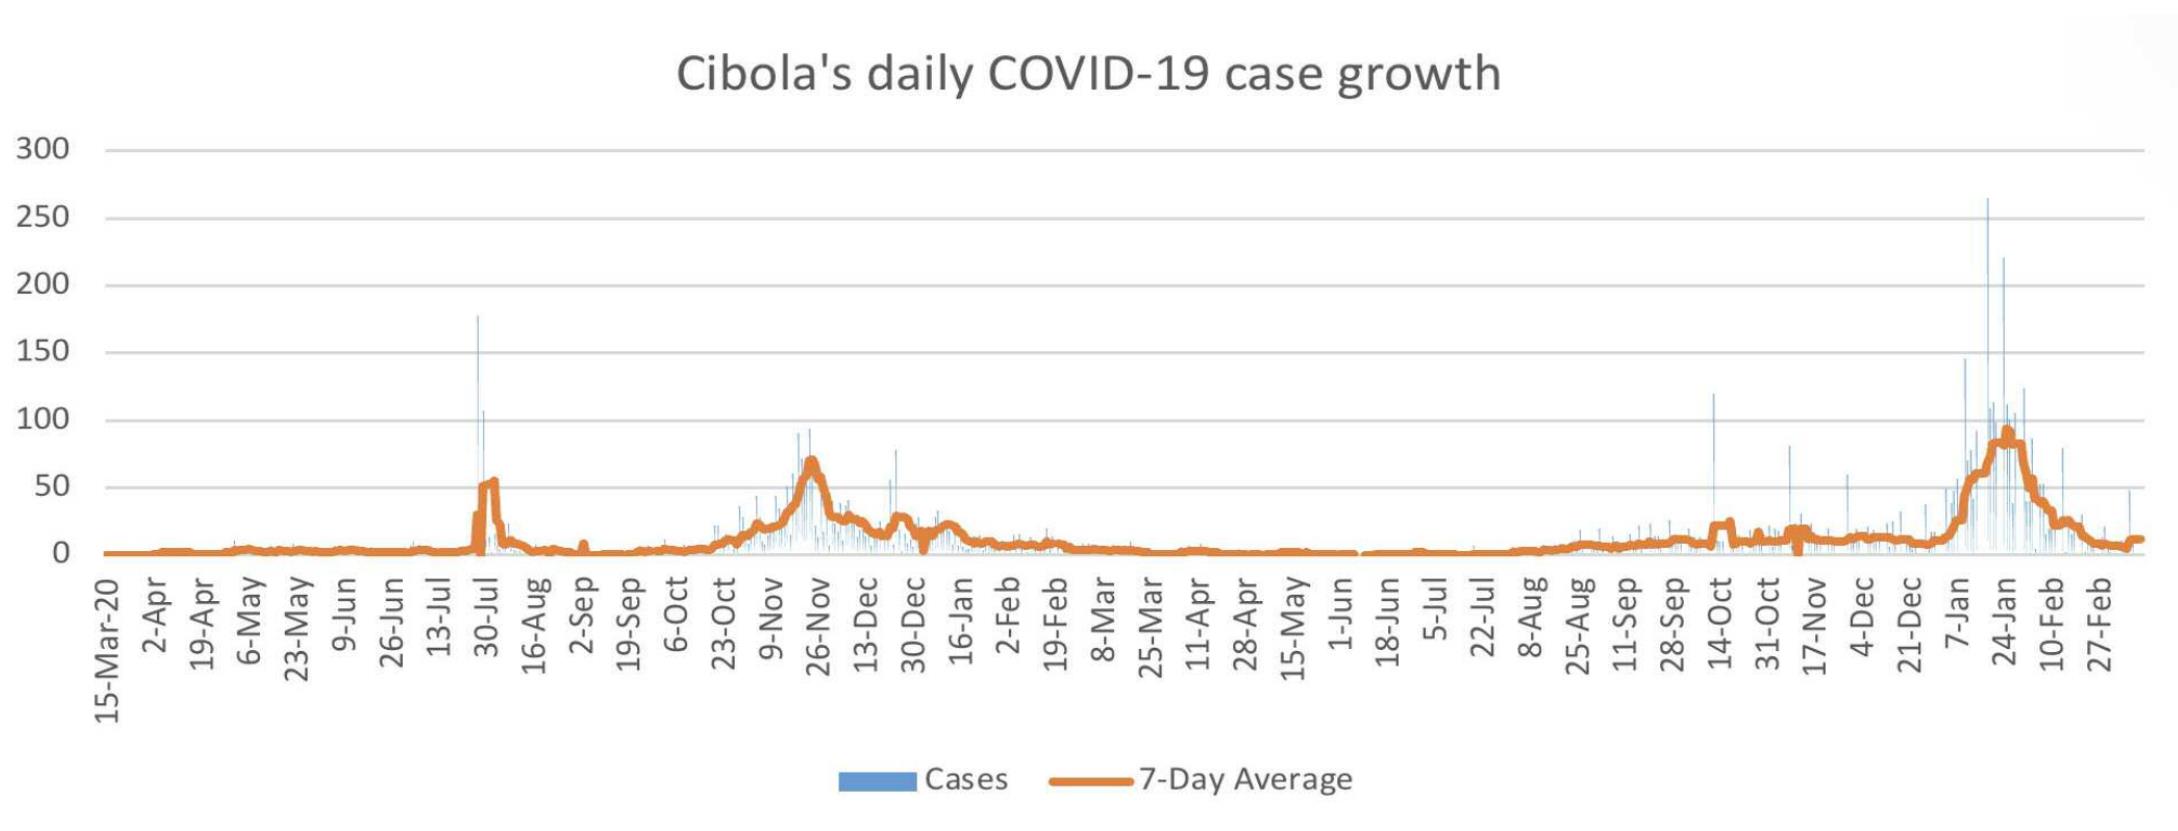
After a devastating wave of Omicron swept over Cibola County at the end of 2021 and stayed until February 2022, COVID-19 has remained on the decline with new cases. Anomalies in data presented by the State of New Mexico have altered Cibola’s graphs and made it difficult to keep accurate information on the pandemic’s toll on the county.
Cibola has suffered wave after wave of COVID-19, starting with the frightening Alpha wave that came to a head in November 2020. Alpha finally slowed to a crawl in March of 2021 before the Delta began in July of 2021. The Delta crisis was slow moving but stayed with Cibola County for months until a worse variant of COVID was arise: Omicron.
In December 2021 Omicron was discovered in the United States, before long it had grabbed hold of Cibola County. January would prove to be a deadly month as Omicron began claiming lives. 10 residents of Cibola County lost their life to COVID-19 in January, another eight would die by the end of February. As of March 14, there have been no new reported COVID-19 deaths among Cibola residents in March. Cibola’s infection rate of COVID-19 remains high, with experts at John Hopkins Bloomberg School of Public Health declaring that counties with high spread like Cibola have seriously undercounted COVID-19 cases and deaths. The World Health Organization has reported that the true death count of COVID-19 will never be known.
Anomalies
The New Mexico Department of Health is usually current on posting the daily COVID-19 reports, with exception to the weekend when it doesn’t post any new numbers. State and federal holidays are other exceptions the Department of Health makes when posting new daily COVID data.
Case data anomaly
The latest data anomaly was on March 4, a Friday, that was followed by two days of non-posting of data. This drop in cases would contribute to the county seeing a drop in it’s daily average of cases to five per day.
On March 10 the data would catch up with the anomalies, and Cibola County reported 48 new cases of COVID-19, with the daily average spiking to twice it’s resting point. The daily average turned to 11 on March 10, and increased to 12 on March 11.
On March 14 the county reported one new case of COVID-19, with a daily average of 12 cases per day.
On a graph, the daily average data jumps significantly from March 10 to March 11, and it may take some time for the daily average data to even out after the anomalies.
Vaccination data anomalies
COVID-19 vaccination data is posted separately from daily case data. Readers will notice that Page A1 of today’s Cibola Citizen no longer has “X Percent of Cibola County is vaccinated.” This is due to inaccurate information used by the State of New Mexico that inflates the vaccination rate in Cibola County. The New Mexico
The New Mexico Department of Health is using data which is inaccurate. According to the Department of Health’s COVID-19 Vaccination data, Cibola has 20,750 residents. This data is grossly inaccurate. The 2019 Census discovered that Cibola has a population of 26,675 residents. This is significantly higher than the state data has, making the state data inaccurate for Cibola County.
As of February 28, there were 15,976 residents who were fully vaccinated. On March 9, there were 15,993 residents fully vaccinated against COVID-19. On March 14, the state reported 19,291 residents being fully vaccinated.
COVID’s change
by age groups
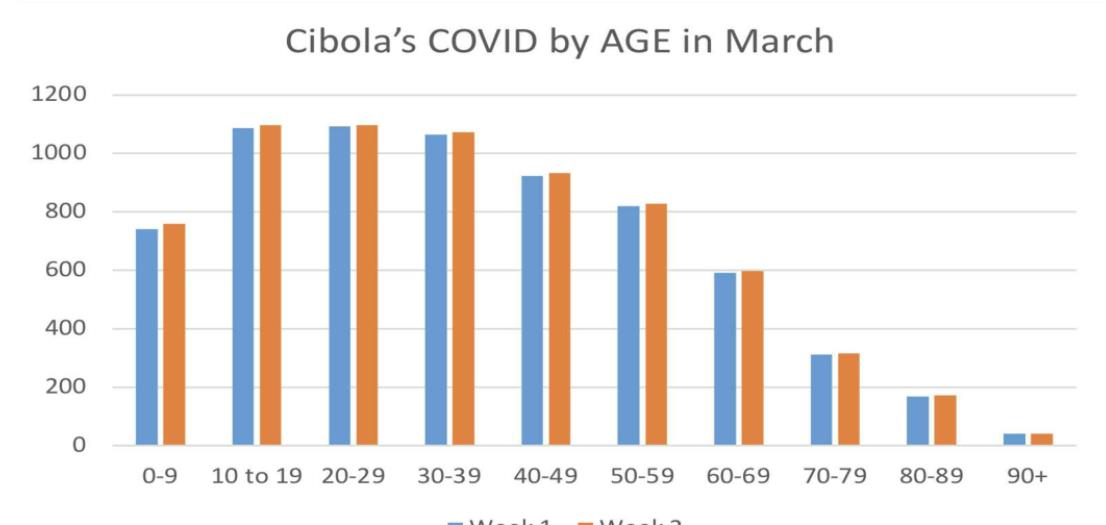
COVID-19 has spread through all of Cibola’s age groups. Like wildfire, COVID-19 has torn through the younger age groups in Cibola, a trend that began to grow after students were reintroduced to the classrooms.
0-9
The youngest age group in Cibola County saw a significant spike in COVID-19 cases through the month of February, gaining a total of 51 new cases through the month, down from 149 new cases recorded through January during the Omicron spike.
On March 9, the 0-9 age group recorded 740 total cases. On March 14 it recorded 758 total cases. An increase of 18 cases through the two-week period.
10-19
Through January, the 10-19 age group added 275 new cases. Through February they added 55 new cases. On March 9 this age group recorded a total of 1086 cases, on March 14 they recorded a total of 1097 cases. This is an addition of 11 cases over a two-week period.
20-29
Over the course of January, the 20–29-year-old age group added 207 new cases. In February they added 50 new cases. On March 9 this age group recorded a total of 1093 cases, on March 14 they had a total of 1097 cases. This is an addition of 14 cases over a two-week period.
30-39
Over the course of January, the 30–39-yearold age group added 202 new cases. In February they added 52 new cases. On March 9 this age group recorded a total of 1063 cases, on March 14 they had a total of 1072 cases. This is an addition of 14 cases over a two-week period.
40-49
Over the course of January, the 40–49-yearold age group added 192 new cases. This begins the departure from massive growth in COVID-19 cases per age group. Adults and especially older residents of Cibola were not among the major spreaders of disease in the county.
In February this age group added 34 new cases. On March 9 the 40–49-year-old group recorded a total of 922 cases, on March 14 they had a total of 933 cases. This is an addition of 11 cases over a two-week period.
50-59
Over the course of January, the 50–59-yearold age group added 124 new cases. In February they added 38 new cases. On March 9 this age group recorded a total of 819 cases, on March 14 they had a total of 827 cases. This is an addition of 8 cases over a two-week period.
60-69
Over the course of January, the 60–69-yearold age group added 89 new cases. In February they added 23 new cases. On March 9 this age group recorded a total of 591 cases, on March 14 they had a total of 596 cases. This is an addition of five cases over a two-week period.
70-79
This age group has recorded the third least amount of new COVID-19 cases.
Over the course of January, the 70–79-yearold age group added 46 new cases. In February they added 14 new cases. On March 9 this age group recorded a total of 311 cases, on March 14 they had a total of 315 cases. This is an addition of four cases over a two-week period.
80-89
This age group has recorded the second least number of COVID-19 cases.
Over the course of January, the 80–89-yearold age group added 18 new cases. In February they added 11 new cases. On March 9 this age group recorded a total of 168 cases, on March 14 they had a total of 172 cases. This is an addition of four cases over a two-week period.
90+
The 90+ demographic has recorded the lowest number of COVID-19 cases in Cibola County.
Over the course of January, the 90+ age group added four new cases. In February they added two new cases. On March 9 this age group recorded a total of 40 cases, this is the same for March 14. No new cases have been added in this age demographic in the last two weeks.
Deaths
10 Residents of Cibola were confirmed to have died from COVID-19 in January. Eight residents died of the disease in February. So far in March, no residents of Cibola County are confirmed to have died from COVID.
Despite the mask mandate having been lifted, some businesses and places of work require masks. These entities, like Cibola General Hospital and many other stores fronts in Cibola, require patrons and visitors to wear their mask. This is for the safety of other customers and visitors; all people are expected to comply with the wishes of these private businesses and entities.