COVID-19 claimed the life of another Cibola County resident in January. While COVID-19 remains deadly, the US Centers for Disease Control say that wearing masks when in socially crowded areas and social distancing are the best ways to prevent catching the disease.
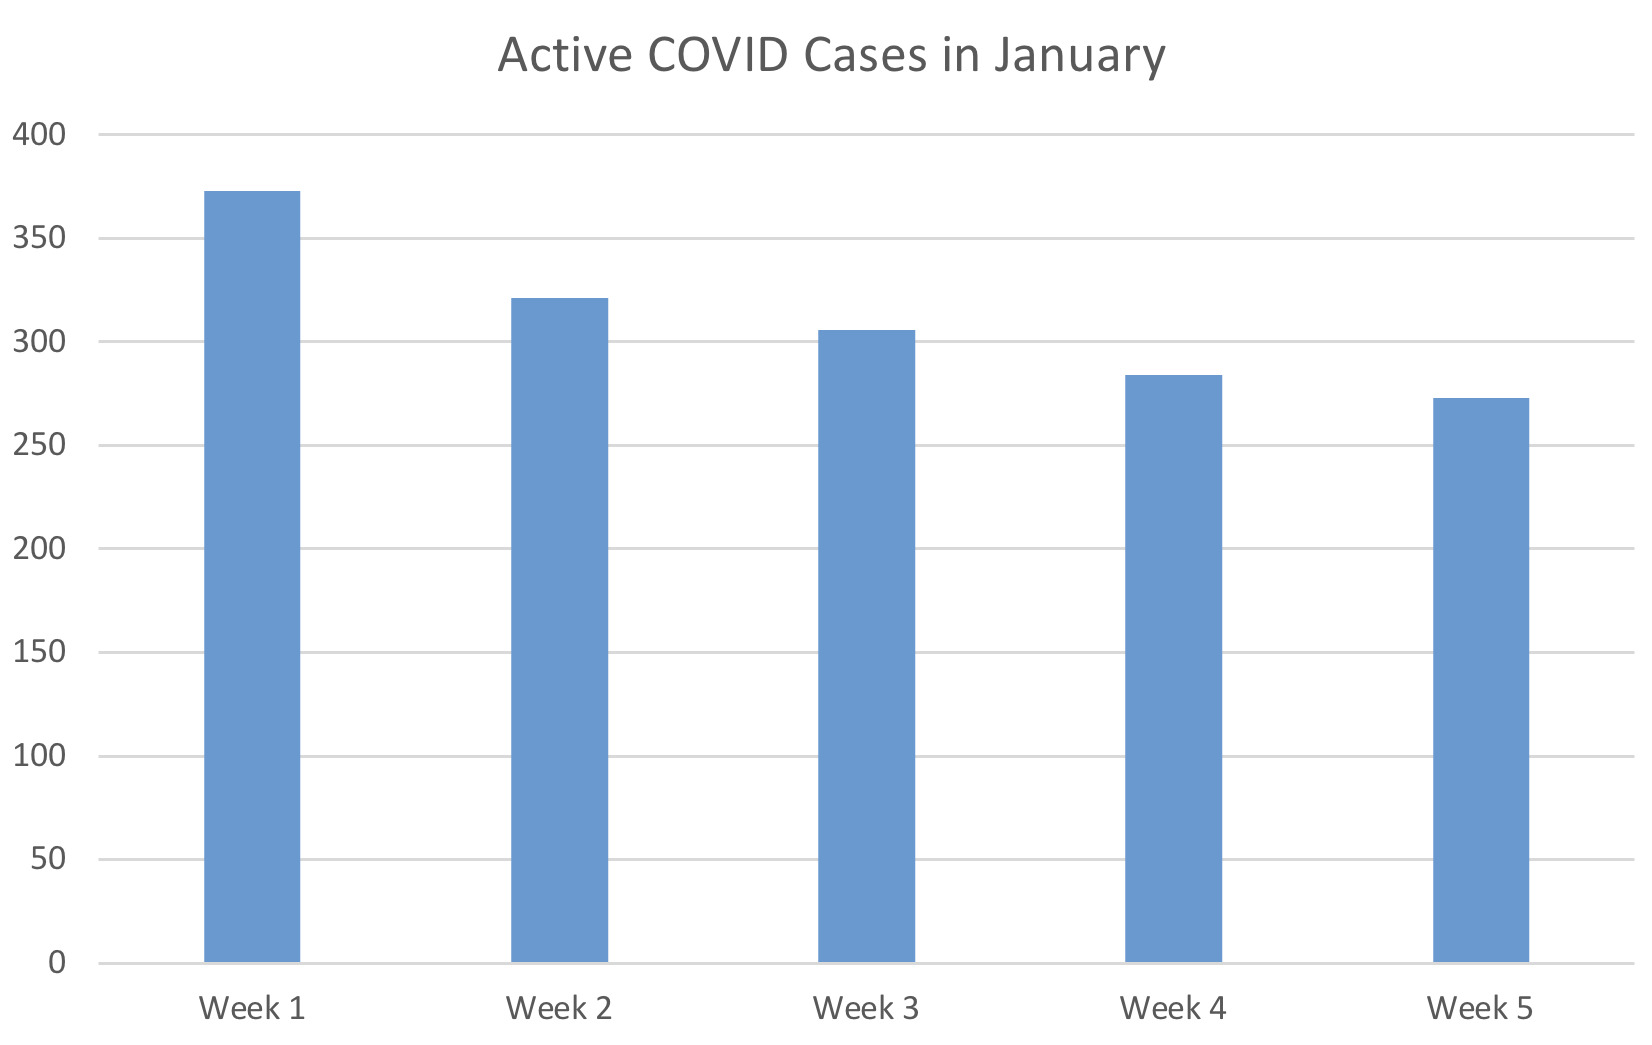
The active case count of COVID in Cibola has appeared to stabilize, staying in the 280 range. In the five weeks of data reporting for January, Cibola lost exactly 100 active cases of COVID, falling from 373 at the beginning of the month to 273 at the end of the month. Cases appear to have stabilized in this general range after three weeks of slight fluctuations in case count.
According to the CDC, Cibola County has a high rate of positive COVID tests but a low level of community transmissibility. This means that cases are more likely to be spread among family members or areas where social distancing is limited like schools and offices, but it is less likely to be caught at larger public areas where proper ventilation and spacing between people is available.
While COVID-19 remains a serious issue, data reporting from the New Mexico Department of Health concerning vaccine rates in Cibola continue to raise questions about potential data inaccuracies. After months of not updating the vaccine rates at the end of 2022, the data was updated. With the new data, Cibola had 16,617 residents fully vaccinated, with 19,904 residents having only one shot. With the first week of data reporting for February, NMDOH took 18 data points away from Cibola’s “one shot” category. The Cibola Citizen is in communication regarding these data inaccuracies to better understand why this keeps happening. Understanding Data Inaccuracies
Vaccine data for Cibola County was questionable after three full months of the same data, with no changes made to the data even after Cibola Citizen staff received their booster shots. Because the data did not change, the newspaper decided to investigate the data. The New Mexico Department of Health tracks vaccine data for every county in the state. This data is collected when pharmacists report their usage of a vaccine. Some data reporting lags because not every pharmacy reports on the same day they used the dose. While the NMDOH may report cases internally, they have not been updating the public data. Trevor Dermody, NMDOH Communications Specialist, did not answer any questions but did send an Excel Spreadsheet of statewide COVID data that had a timestamp of December 27, with an updated sheet of vaccinations per county; that same day, the public data was updated.
The month of October began with 19,867 residents who had only one COVID-19 shot; 16,564 had received at least two shots. These numbers did not change through the five weeks or data reporting for October, the four for November, or the four for December. The numbers finally changed in the first week of reporting in January.
Even though the numbers changed for the first week of January, they did not budge the rest of the month. It wasn’t until 18 vaccine points were taken from Cibola at the beginning of February that the data changed.
COVID Increases in January
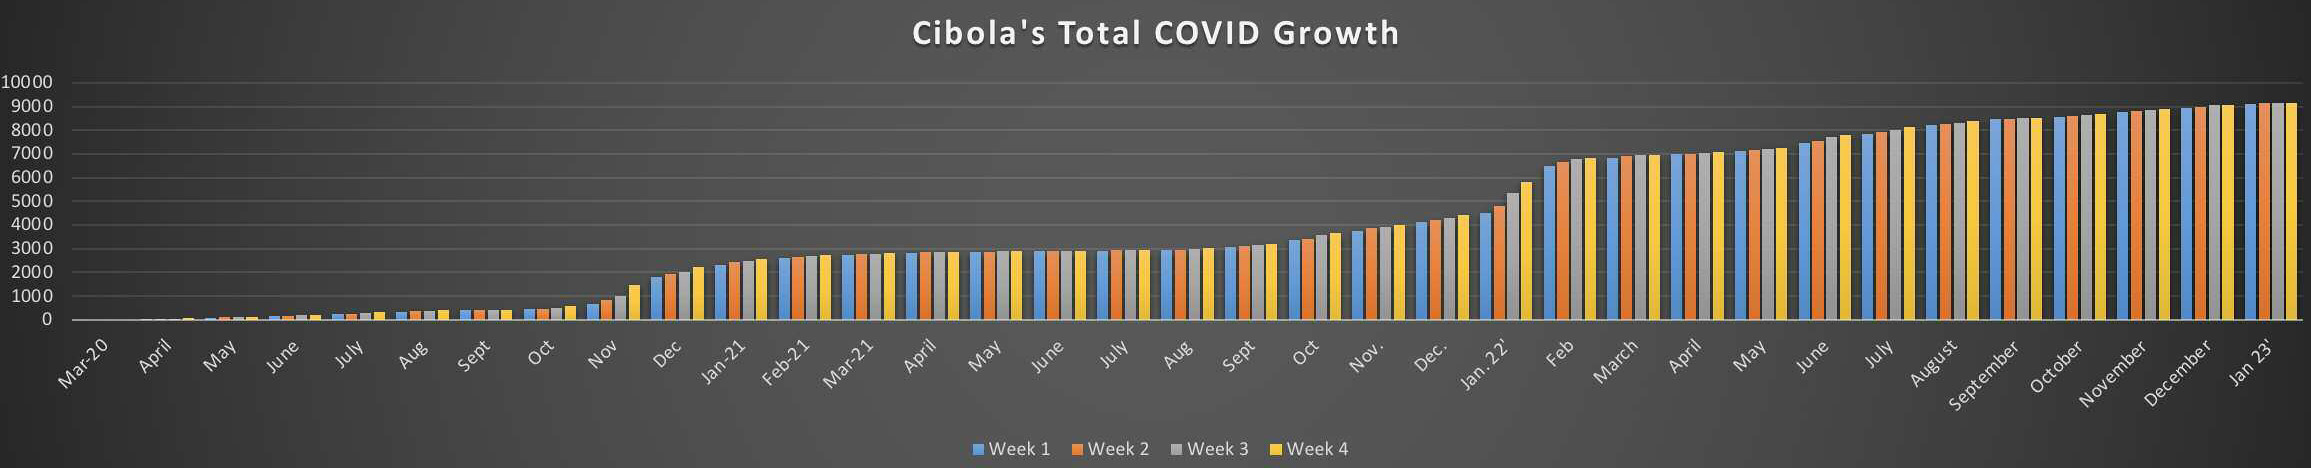
In a total departure from one year ago, January 2023 only added 78 new cases of COVID-19 to Cibola’s total case count. In comparison, January 2022 saw 1,311 new cases added.
2023 is starting the year off in a much better position than 2022.
When January began, Cibola had 9,106 cases. When the month ended, Cibola had 184 cases, this means 78 new cases were added.
In 2023, there was only one month where Cibola added less than 100 new cases, that was in September when the county only added 70 cases. November 2022 added 119 new cases and December added 125 new cases. In comparison, Jan. 2023 only added 78 new cases.
When January began, there were 373 active cases in Cibola County. This number dropped to 321 in the second week of the month, then again to 306 active cases in the third week. The number dropped again to 284 in the fourth week of the month, and finally dropped once again to 273 active cases at the end of the month. Currently, with the first week of data reporting for February, Cibola has increased to 280 active cases across the county.
New Cases in Cibola
October had 160 new cases. November had 119 new cases. December had 124 new cases.
January added 78 new cases.
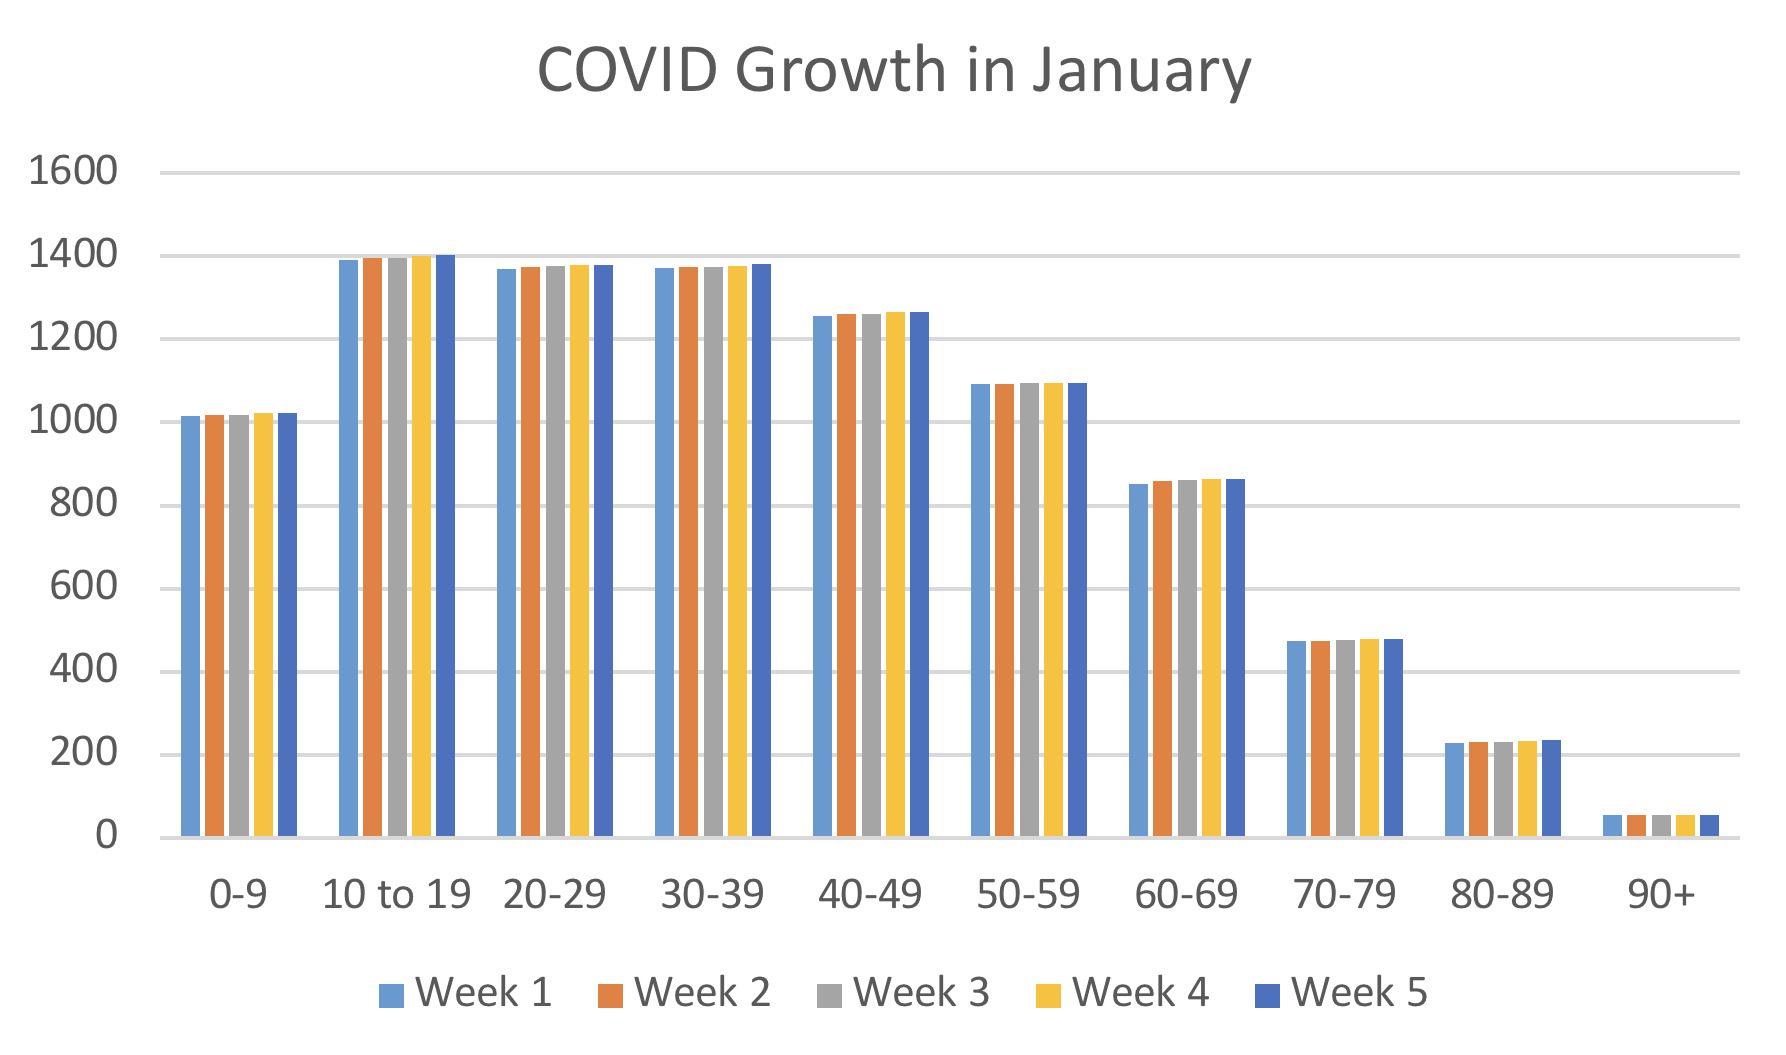
COVID-19 Increases by Age Group
Through January, the 10 to 19 and 60 to 69 age demographics tied for adding the most amount of new COVID-19 cases. They were followed by another tie between the 20-29 and 30-39 age demographics for the second highest increase of cases through the month. The 40-49 age group added the third highest number of new cases to the county.
Both the 10-19 and 60-69 demographics added 12 new cases to Cibola’s total case count.
Both the 20-29 and 30-39 demographics added 10 new cases each.
The 40-49 demographic added only eight new cases.
The 90+ age demographic broke a twomonth streak of no new cases by adding one case to the county’s total count.
The 80-89 age demographic added seven new cases in January.
The 70-79 age demographic added five new cases.
The 50-59 age demographic added four new cases.
The 0-9 age demographic added seven new cases.