
2021-2022
Q2
Tracking and recording economic data for Cibola County is very difficult. The data is not centralized, and the New Mexico Department of Workforce Connection makes access to data for unemployment very difficult. To combat this, the Cibola Citizen has decided to gather the data as efficiently as possible and centralize it for easier access.
This jobs report is in its early stages, with more data necessary to fully flush out the report. Work on this report began in November, because of this, a significant amount of data for July through October is no longer accessible. Moving forward, this data will be recorded by the Citizen and held for record, so long as it pertains to Cibola County.
What is a Quarter?
This report will follow the fiscal year. There are four quarters in the fiscal year. The first quarter is made up of the months July, August, September. The second quarter is made up of October, November, December. The third quarter is made up of January, February, March. The fourth and final quarter is made up of April, May, June.
Unemployment Numbers
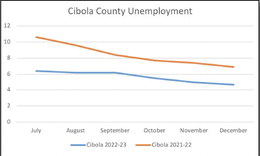
Cibola County is sitting with a current unemployment rating of 4.7 percent.
The current rating is a departure from the rest of the second quarter. In October, the unemployment rating was at 5.5 percent, and in November the rating had fallen to a flat five percent.
When compared to 2022: In October, Cibola had an unemployment rating of 7.7 percent. In November, it was 7.4 percent, and December had Cibola at 6.9 percent.
The current unemployment rating is following a trend that has persisted since June 2021 of economic recovery. In June 2021, Cibola had an unemployment rate of 11.1 percent. This was the highest unemployment rating since January 1997, when unemployment was at 14.1 percent. Since June ’21, unemployment has been on a mostly-steady downhill slope.
Current unemployment numbers show a healthy economic recovery for Cibola County, following years of economic turbulence brought on by COVID-19.
Job Seekers
Business owners who are looking for employees may be relieved to know that there are currently enough potential employees to fill available jobs.
Data from the United States Bureau of Labor Statistics shows that, as of December, there are 4.41 candidates for every available job in the county.
As of December, there were 382 job openings available for candidates in Cibola County. In November, there were 346 job openings. This shows that positions were either filled, or businesses pulled some of their positions.
As of December, there were 1,686 candidates per job opening. This is four more than in November, when there were 1,682 candidates. This shows that four job seekers in the county either left their jobs, or were removed from their jobs.
With this data compiled, as of December, Cibola has 4.41 job seekers per available job. In November the county had 4.86 job seekers per available job.
Wage Data
Employees expect employers to be competitive with their wages.
The New Mexico Department of Workforce Solutions keeps quarterly data on wages in Cibola. The following data is for the second quarter.
The average hourly wage in Cibola is: $20.60 The average weekly pay is: $824 The average annual pay is: $42,848
Is Cibola Spending?
The economy can be most easily tracked by how much Cibola is spending. While it’s almost impossible to tell exactly how much money is being spent on a monthly basis, the health of the economy can be tracked by how much Gross Receipts Tax is brought in to the various governments of Cibola.
Every time a person goes to make a purchase, whether its for cleaning supplies, gasoline, or any other miscellaneous item, a small percentage of the total cost is levied by the government( s) that purchase was made in.
The Cibola Citizen thanks the governments of Cibola County, Village of Milan, and City of Grants for making access to these reports simple, and easy to read.
City of Grants:
October 2022 saw $785,416 in GRT, compared to Oct 2021 where the city brought in $781,637.
November 2022 saw $756,384 in GRT, compared to Nov. 2021 where the city brought in $770,539.
December 2022 saw $810,830 in GRT, compared to Dec. 2021 where the city brought in $737,252.
Village of Milan:
October 2022 saw $292,081 in GRT, compared to Oct. 2021 where the village brought in $202,139.
November 2022 saw $293,871 in GRT, compared to Nov. 2021 where the village brought in $232,728.
December 2022 saw $266,800 in GRT, compared to Dec. 2021 where the village brought in $240,461.
Cibola County: October 2022 saw $561,147 in GRT, compared to Oct. 2021 where the county brought in $391,129.
November 2022 saw $494,626 in GRT, compared to Nov. 2021 where the county brought in $391,129.
December 2022 saw $533,954 in GRT, compared to Dec. 2021 where the county brought in $391,129.
About this data
The New Mexico Department of Workforce Connection tracks economic data for the state, accessing this data is difficult and the state does not keep this data in a centralized location.
To access data on Cibola’s workforce, the Cibola Citizen utilizes federal resources. Specifically, the US Bureau of Economic Analysis, the US Bureau of Labor Statistics, and the 2020 and 2010 US Censuses.
To access data on Gross Receipts Tax, the Cibola Citizen thanks the governments of Cibola County, Village of Milan, and City of Grants for their diligent financial reports which make access of tax collections simple and transparent.
To access wage data, the Cibola Citizen utilizes the New Mexico Department of Workforce Connection.
Looking to the Future
The Cibola Citizen is looking to expand this quarterly report for the future. If readers have ideas on ways we can further track and analyze the local economy, please email the newspaper at editor@cibolacitizen.com