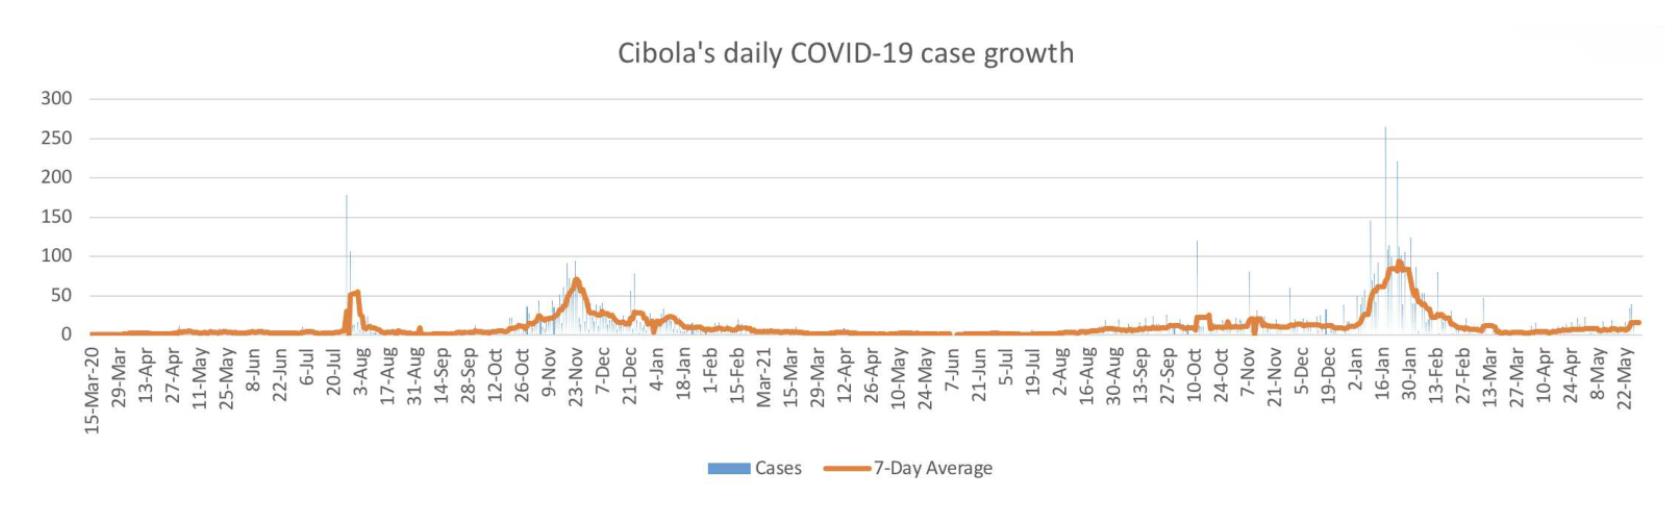
COVID-19 continues its slow raise in cases across Cibola County. Because of Memorial Day, the New Mexico Department of Health did not report cases on Monday, meaning the May 31 case report will be abnormally large. Cases have spiked, even without the end-of-month report, and are bringing Cibola to levels near that of Omicron in March.
Despite anomalies in vaccine data, Cibola County residents have been COVID-19 vaccinations. The county saw a significant increase in vaccinations between May 23 and June 30.
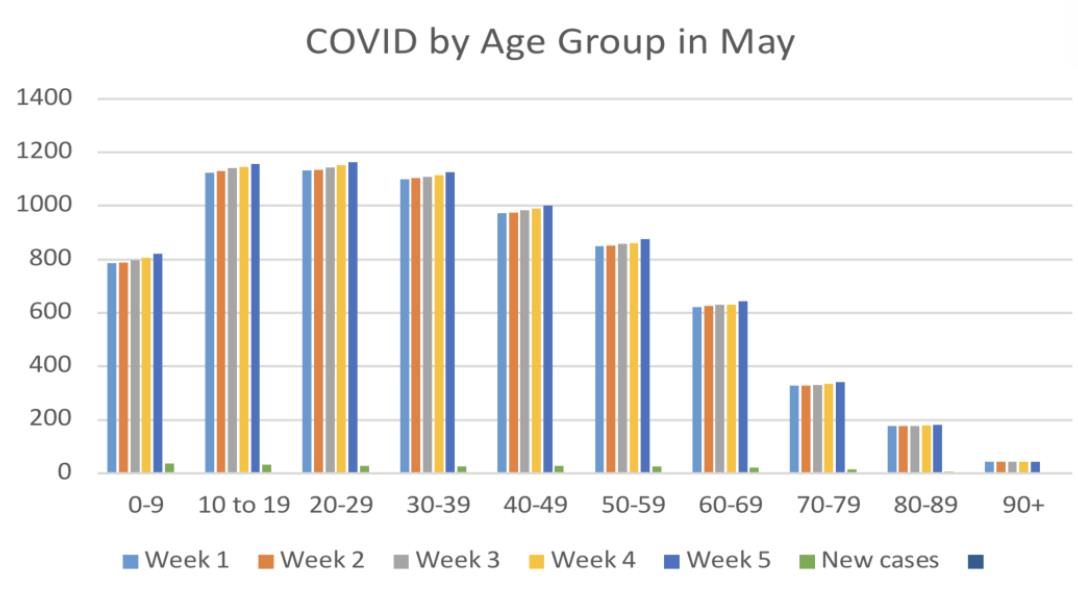
School aged children are once again leading the COVID-19 charge, while the 90+ demographic sees zero new cases in the week.
As of May 30, deaths from COVID-19 are on the decrease in Cibola County.
Growing Cases
On April 25 Cibola County had 304 active cases. This was the beginning of the slow increase that would plague Cibola. On May 2, Cibola had 344 active COVID-19 cases. This was an increase of 36 active cases from the previous week.
On May 9, Cibola had 352 active cases. This was an increase of eight cases, which was not in itself a cause for alarm, on a graph the cases appeared as though they may be stagnating, this was not the case.
On May 16, Cibola had 375 active cases. This was an increase of 23 cases. On May 23 Cibola had 366 active cases, this was a decrease of nine cases. Despite the decrease in active cases, the 14-day change rate showed a decrease in cases, experts from the US Centers for Disease Control cautioned that this may be an anomaly in data reporting. This means that cases in Cibola County are seriously undercounted.
On May 30, Cibola had 382 active cases. This is an increase of 16 cases, Cibola County’s 14-day change rate jumped dramatically; going from seven cases a day, to 11, to 16 cases where the number rests as of press time. This means that there are at least 16 new COVID-19 infections every day, this number may be larger as not every positive test is counted in the NMDOH report because not all home tests are reported.
The May 30 report is the same data as was reported in the May 27 report, meaning it did not include the weekend’s numbers or Memorial Day’s – Monday’s – numbers. When the May 31 report is released, it will include the numbers for four days and will be a significant spike when put on a graph.
Vaccination Report
Over the month of May, 99 Cibola County residents became fully vaccinated.
On May 2, there were 16,153 residents with their vaccination series completed, by May 30 the report concluded 16,252 residents were fully vaccinated.
117 people received at least one COVID-19 vaccination shot over the month.
On May 2, 19,345 residents had at least one shot. By May 30, 19,462 residents had at least one shot.
These numbers were subject to anomalies. In the May 23 report, the single vaccination shot report changed from being in the 19,000s to being in the 16,000s. The report was quickly corrected.
Age Groups
School aged children are once again leading the case growth in Cibola County, just days after the Grants/Cibola County School District academic year comes to an end. The age group 0-9 had an increase of 36 cases; the 10-19 age group had an increase of 33 cases; the 20-29 and 40-49 age groups tied for the third highest increase in cases this month at 29 cases.
0-9
On May 2, this age group had 785 COVID-19 cases. On May 30, they reported 821 cases. This is an increase of 36 cases over the month.
10-19
On May 2, this age group had 1123 COVID-19 cases. On May 30, they reported 1156 cases. This is an increase of 33 cases over the month.
20-29
On May 2, this age group had 1133 COVID-19 cases. On May 30, they reported 1162 cases. This is an increase of 29 cases over the month.
30-39
On May 2, this age group had 1099 COVID-19 cases. On May 30, they reported 1126 cases. This is an increase of 27 cases over the month.
40-49
On May 2, this age group had 972 COVID-19 cases. On May 30, they reported 1001 cases. This is an increase of 29 cases over the month.
50-59
On May 2, this age group had 849 COVID-19 cases. On May 30, they reported 875 cases. This is an increase of 26 cases over the month.
60-69
On May 2, this age group had 622 COVID-19 cases. On May 30, they reported 644 cases. This is an increase of 22 cases over the month.
70-79
On May 2, this age group had 328 COVID-19 cases. On May 30, they reported 342 cases. This is an increase of 14 cases over the month.
80-89
On May 2, this age group had 176 COVID-19 cases. On May 30, they reported 182 cases. This is an increase of 6 cases over the month.
90+
This age group did not have a single increase in cases this month. This age group has stayed at 43 cases since the beginning of the month.
Death on the Decrease
As of May 30, Cibola County has lost a total of 193 residents.
By press time, deaths were on the decrease in Cibola by seven percent. Because the official caseload of cases is likely undercounted, so too are the deaths.