
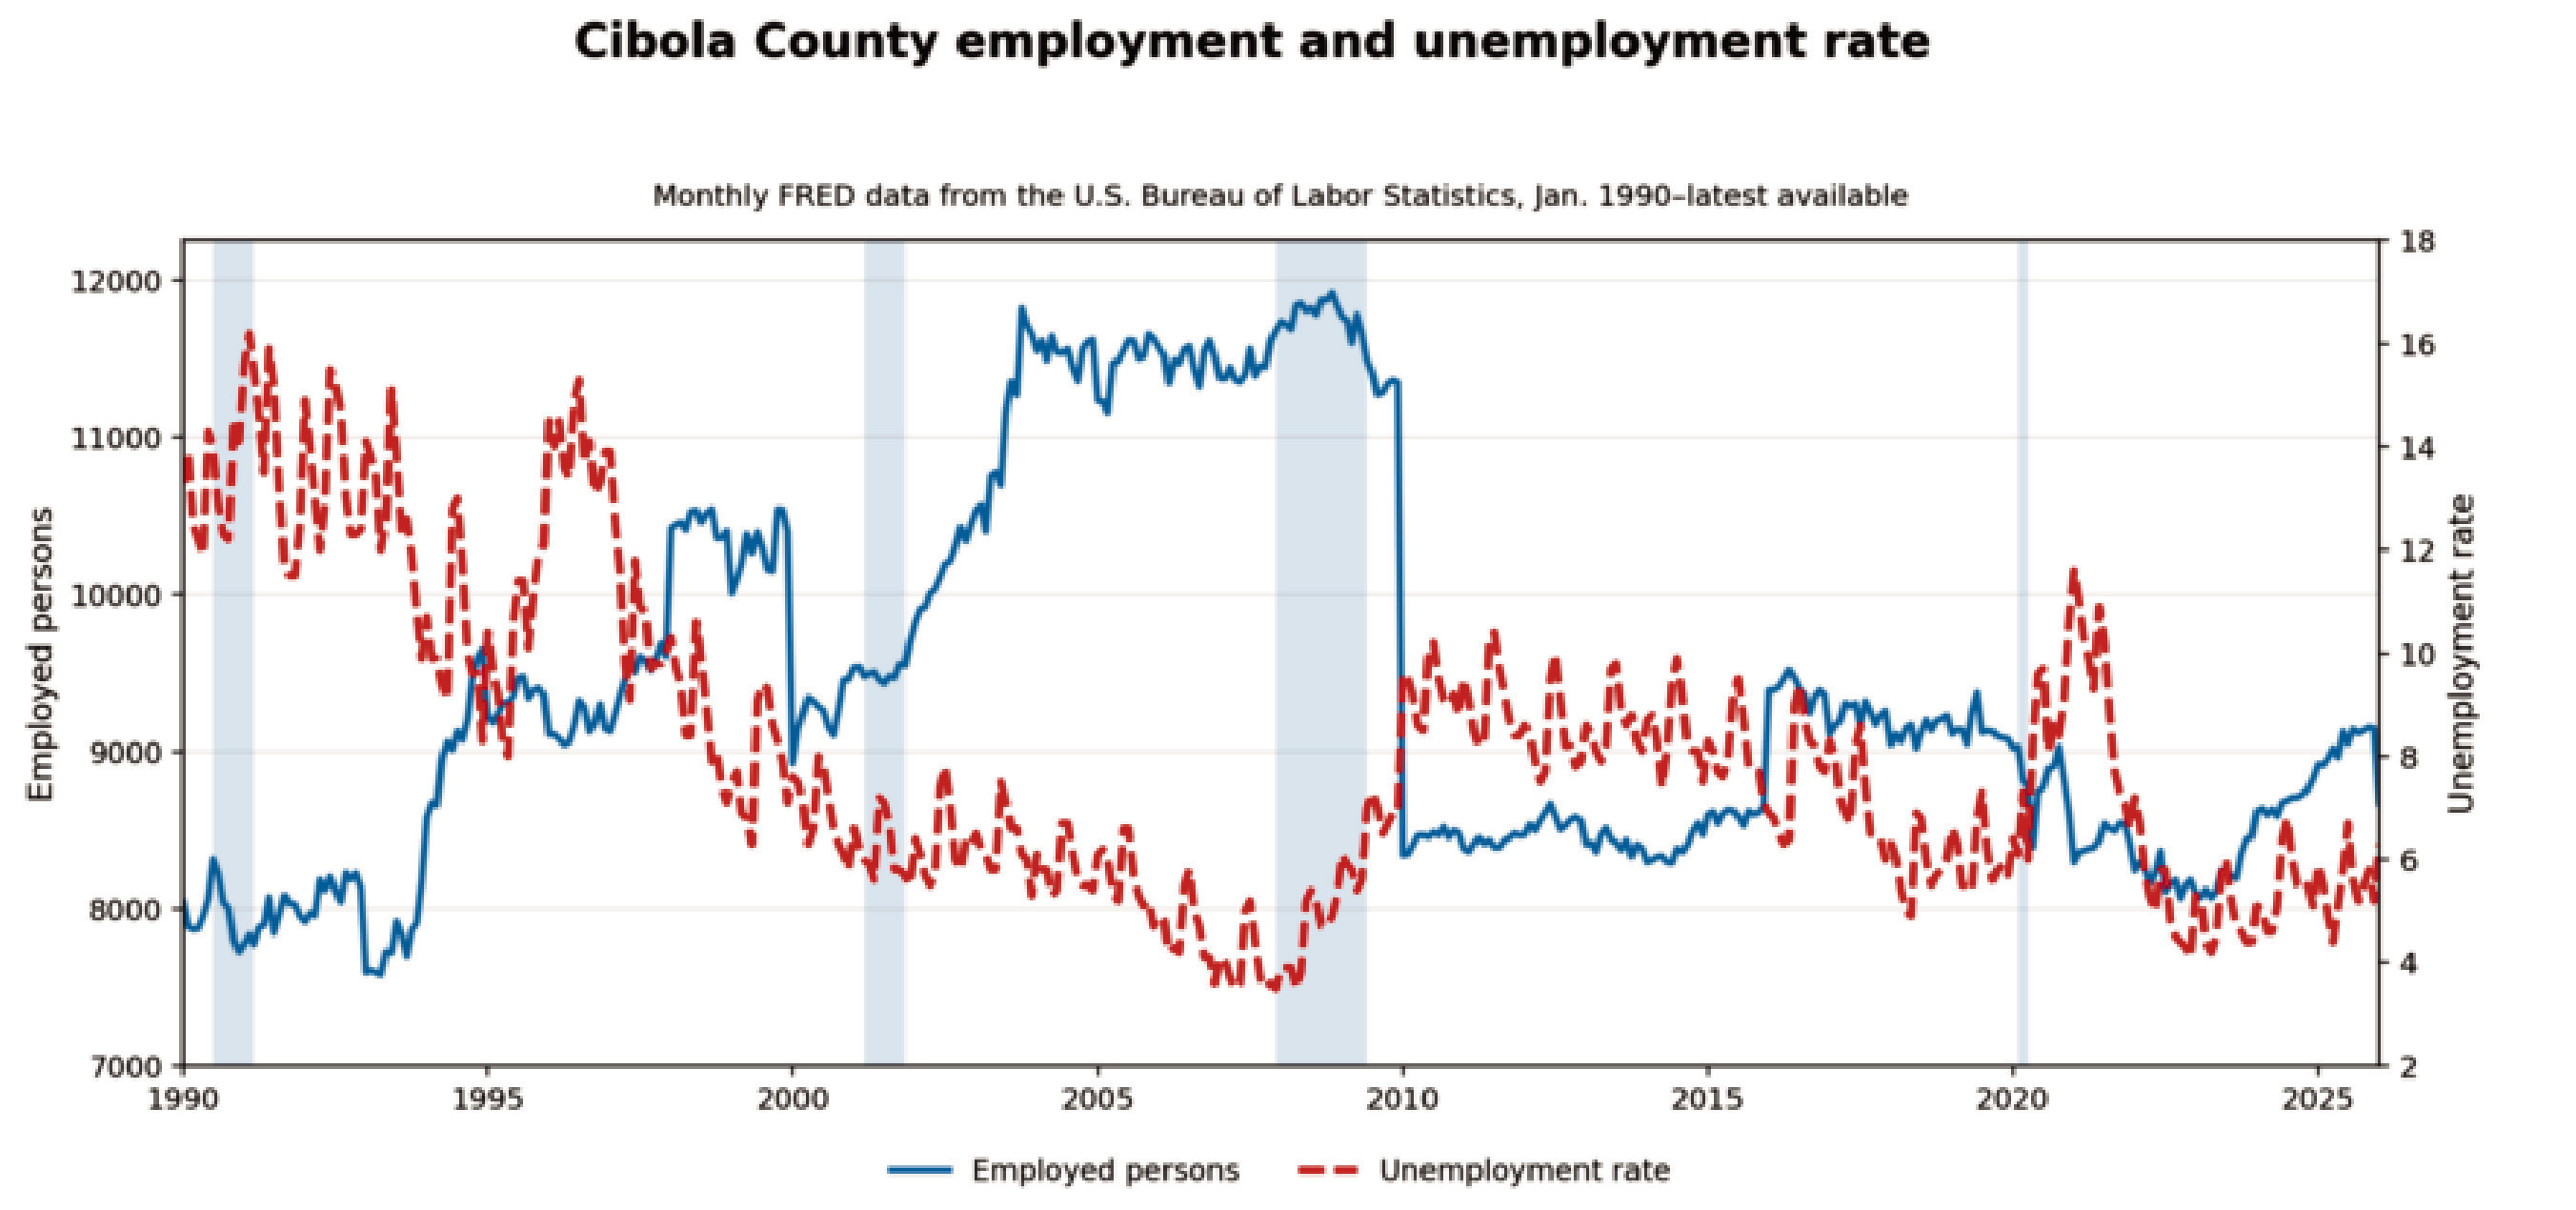
CIBOLA COUNTY, N.M. - This chart shows two different ways of looking at Cibola County’s labor market.
The solid employment line shows the estimated number of Cibola County residents who were employed each month. That number is measured on the left side of the chart. The red dashed line shows the county’s unemployment rate, which is measured on the right side of the chart as a percentage of the labor force.
Because the two measures use different units – people and percent – they are shown on separate vertical scales. That means the lines should not be compared directly by height. Instead, readers should look at the direction and timing of each line.
The employment line helps show whether more or fewer Cibola County residents are working over time.
The unemployment rate shows the share of the labor force that is actively looking for work but not employed.
Detailing Cibola County’s economic history, the chart shows employment rising through much of the 1990s and 2000s before falling sharply around the Great Recession period. Since then, the county’s employment count has remained below the highs reached before 2010.