In a reminder that it is still present and very deadly, COVID-19 was responsible for the deaths of two Cibola residents while increasing active cases to their highest point since early September.
As deaths persist, vaccination rates in Cibola County have hit an all-time low. COVID-19 continues to spread through the community every week, increasing an extra 10 active cases in just the past week alone. COVID has been on the increase in Cibola since October, with the disease appearing to slow for a few days before increasing even higher. Colder temperatures are driving residents inside of their homes or more cramped locations to stay warm that have limited ventilation, according to the US Centers for Disease Control, this contributes to the spread of COVID. Marking the increase in COVID spread across Cibola, the CDC has increased Cibola to “Medium” on their scale determining the danger of disease spread in a community.
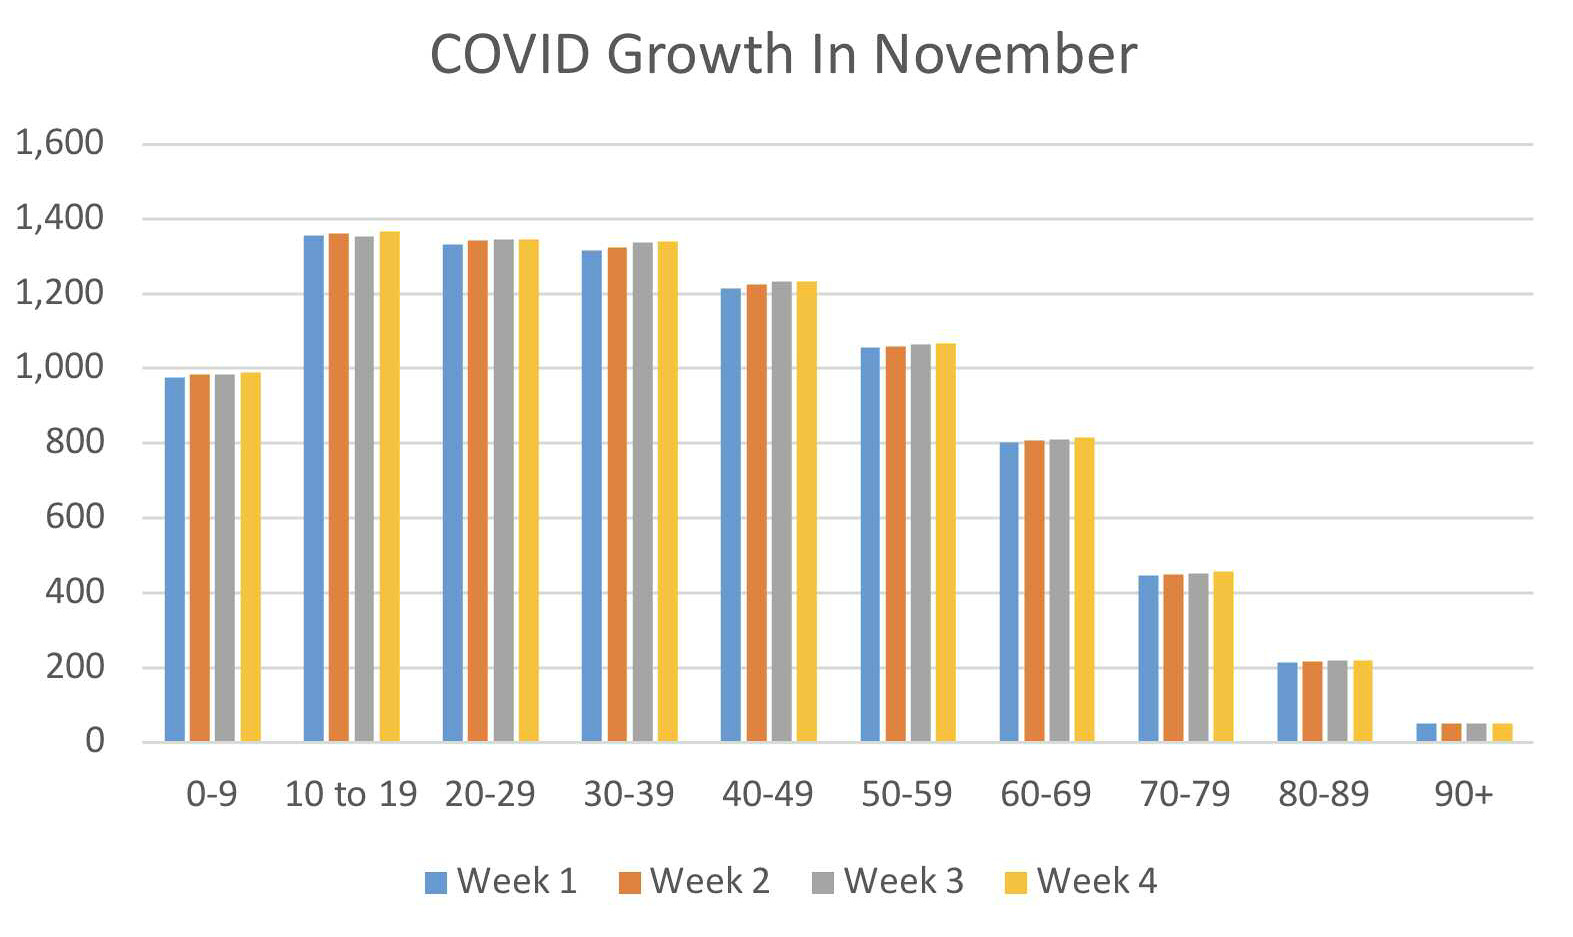
COVID spread in Cibola was once again led by only one age group, unlike previous months, November was led by people aged 30-39. The 40-49-year-old demographic contributed to the second highest increase, followed by the 20-29 age demographic. The 90+ demographic is the only age group to not add any new cases through the month.
Because of the rise of at-home COVID-19 tests and a fall in testing, Cibola’s COVID data is inaccurate, the state of spread in the community is likely significantly larger than can be represented on a graph. The inaccuracies come because not every positive COVID test is reported to the state department of health, this data only includes confirmed positive cases where a test was turned into the state.
For the fourth consecutive month, there has been no increase in COVID vaccinations. This data comes directly from the New Mexico Department of Health, who reports new vaccinations per county every day.
COVID Increases in November
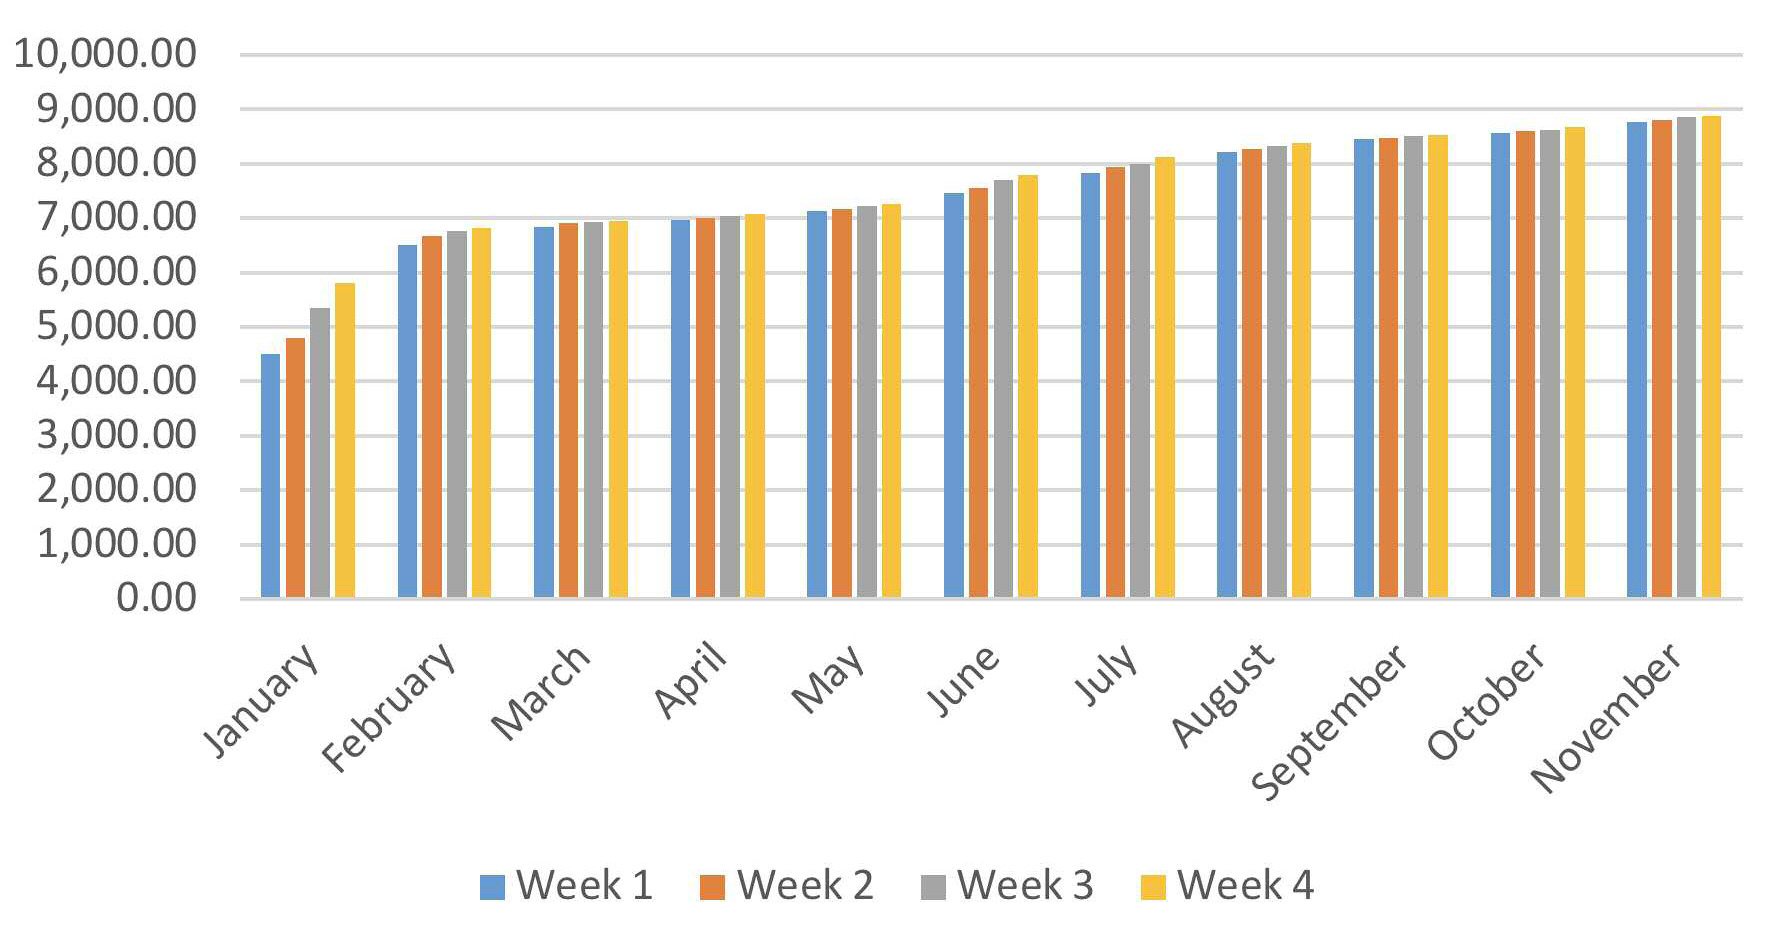
COVID-19 was on the rise in November, leading to a high case count for the beginning of December. Despite the increase, it was still less than October’s increase.
As the month began, Cibola had 8,764 total cases, when the month ended there were 8,883 total cases, this means 119 cases were added through the month. This means there were 119 new COVID-19 cases reported through November, compared to 160 new cases reported in October and 70 in September. September remains the only month of 2022 where Cibola added less than 100 new cases.
When the month began, Cibola had 345 active cases. This number increased to 365 in the second week of November. By the third week, active cases had dropped by one to 364. The month ended with 350 active cases which led to an increase in active cases just a week later. The first week of December sees Cibola with 360active cases, the highest since the first week of September.
New Cases in Cibola
January had 1,311 new cases. February had 308 new cases. March had 115 new cases. April had 106 new cases. May had 222 new cases. June had 330 new cases. July had 290 new cases. August had 217 new cases. September had 70 new cases. October had 160 new cases.
November added 119 new cases. COVID-19 Increase by Age Group
The 30-39-year-old age demographic led the increase of COVID-19 in Cibola County. The 40-49-year-old group had the second highest increase and the 20-29-year-old group had the third highest increase of cases.
The 30-39 age demographic increased the count by 24 cases, no other age group had an increase of 20 or higher through November.
The 40-49-year-old group increased Cibola’s total case count by 19 cases in November.
The 20-29-year-old age group added 14 new cases to Cibola’s total COVID case count.
The 90+ age group did not add a single case in November, the lowest increase in Cibola’s case count. The 80-89 age group added only five cases through, the second lowest increase. With the third lowest increase, the 70-79-year-old and 10-19-year-old demographics both added 10 cases.
As cases continue to increase, vaccinations have slowed to a complete stop. The last time Cibola saw an increase in vaccinations was at the end of July.